自定义抓取配置
在prometheus目录下创建一个新目录AdditionalScrapeConfigs用来存放集群外部一些抓取的配置文件
➜ ~ mkdir -p prometheus/AdditionalScrapeConfigs在目录AdditionalScrapeConfigs中新建两个文件:additional-scrape-configs-Secret.yaml和additional-scrape-configs-ConfigMap.yaml,示例如下:
additional-scrape-configs-Secret.yaml(新建)
apiVersion: v1
kind: Secret
metadata:
  name: prometheus-additional-scrape-configs-secret
  namespace: monitoring
  labels:
    app.kubernetes.io/component: prometheus-targets
    app.kubernetes.io/instance: main
    app.kubernetes.io/name: prometheus-additional-scrape-configs
    app.kubernetes.io/part-of: kube-prometheus
    app.kubernetes.io/version: 0.23.0
stringData:
  prometheus-additional-scrape.yaml: |
    # 以下内容自定义
    - job_name: node-exporter
      file_sd_configs:
        - files:
            - /additional-scrape-configs/node-exporter.yaml
          refresh_interval: 30s
      relabel_configs:
        - source_labels:
            - __address__
          regex: '(.*):9100'
          target_label: instance
          action: replace
          replacement: $1
    - job_name: container-exporter
      file_sd_configs:
        - files:
            - /additional-scrape-configs/container-exporter.yaml
          refresh_interval: 30s
type: Opaque
additional-scrape-configs-ConfigMap.yaml(新建)
apiVersion: v1
kind: ConfigMap
metadata:
  name: prometheus-additional-scrape-configs-configmap
  namespace: monitoring
  labels:
    app.kubernetes.io/component: prometheus
    app.kubernetes.io/instance: main
    app.kubernetes.io/name: prometheus-additional-scrape-configs
    app.kubernetes.io/part-of: kube-prometheus
    app.kubernetes.io/version: 0.23.0
data:
  node-exporter.yaml: |
    # 以下内容自定义
    - targets:
        - "192.168.33.254:9100"
  container-exporter.yaml: |
    # 以下内容自定义
    - targets:
        - "192.168.33.254:9080"
prometheus-prometheus.yaml(更新)
apiVersion: monitoring.coreos.com/v1
kind: Prometheus
metadata:
  labels:
    app.kubernetes.io/component: prometheus
    app.kubernetes.io/instance: k8s
    app.kubernetes.io/name: prometheus
    app.kubernetes.io/part-of: kube-prometheus
    app.kubernetes.io/version: 2.32.1
  name: k8s
  namespace: monitoring
spec:
  ...
  version: 2.32.1
  ## 新增以下配置
  # 挂载configMap
  volumeMounts:
    - name: prometheus-additional-scrape-configs-configmap
      mountPath: /additional-scrape-configs
      readOnly: true
  # 定义volumes
  volumes:
    - name: prometheus-additional-scrape-configs-configmap
      configMap:
        name: prometheus-additional-scrape-configs-configmap
  # 添加集群外的targets
  additionalScrapeConfigs:
    name: prometheus-additional-scrape-configs-secret
key: prometheus-additional-scrape.yaml使用kubectl apply创建和更新相关资源
# 创建定义的Secret和ConfigMap资源
➜ ~ kubectl apply -f prometheus/AdditionalScrapeConfigs
configmap/prometheus-additional-scrape-configs-configmap created
secret/prometheus-additional-scrape-configs-secret created
# 更新Prometheus资源
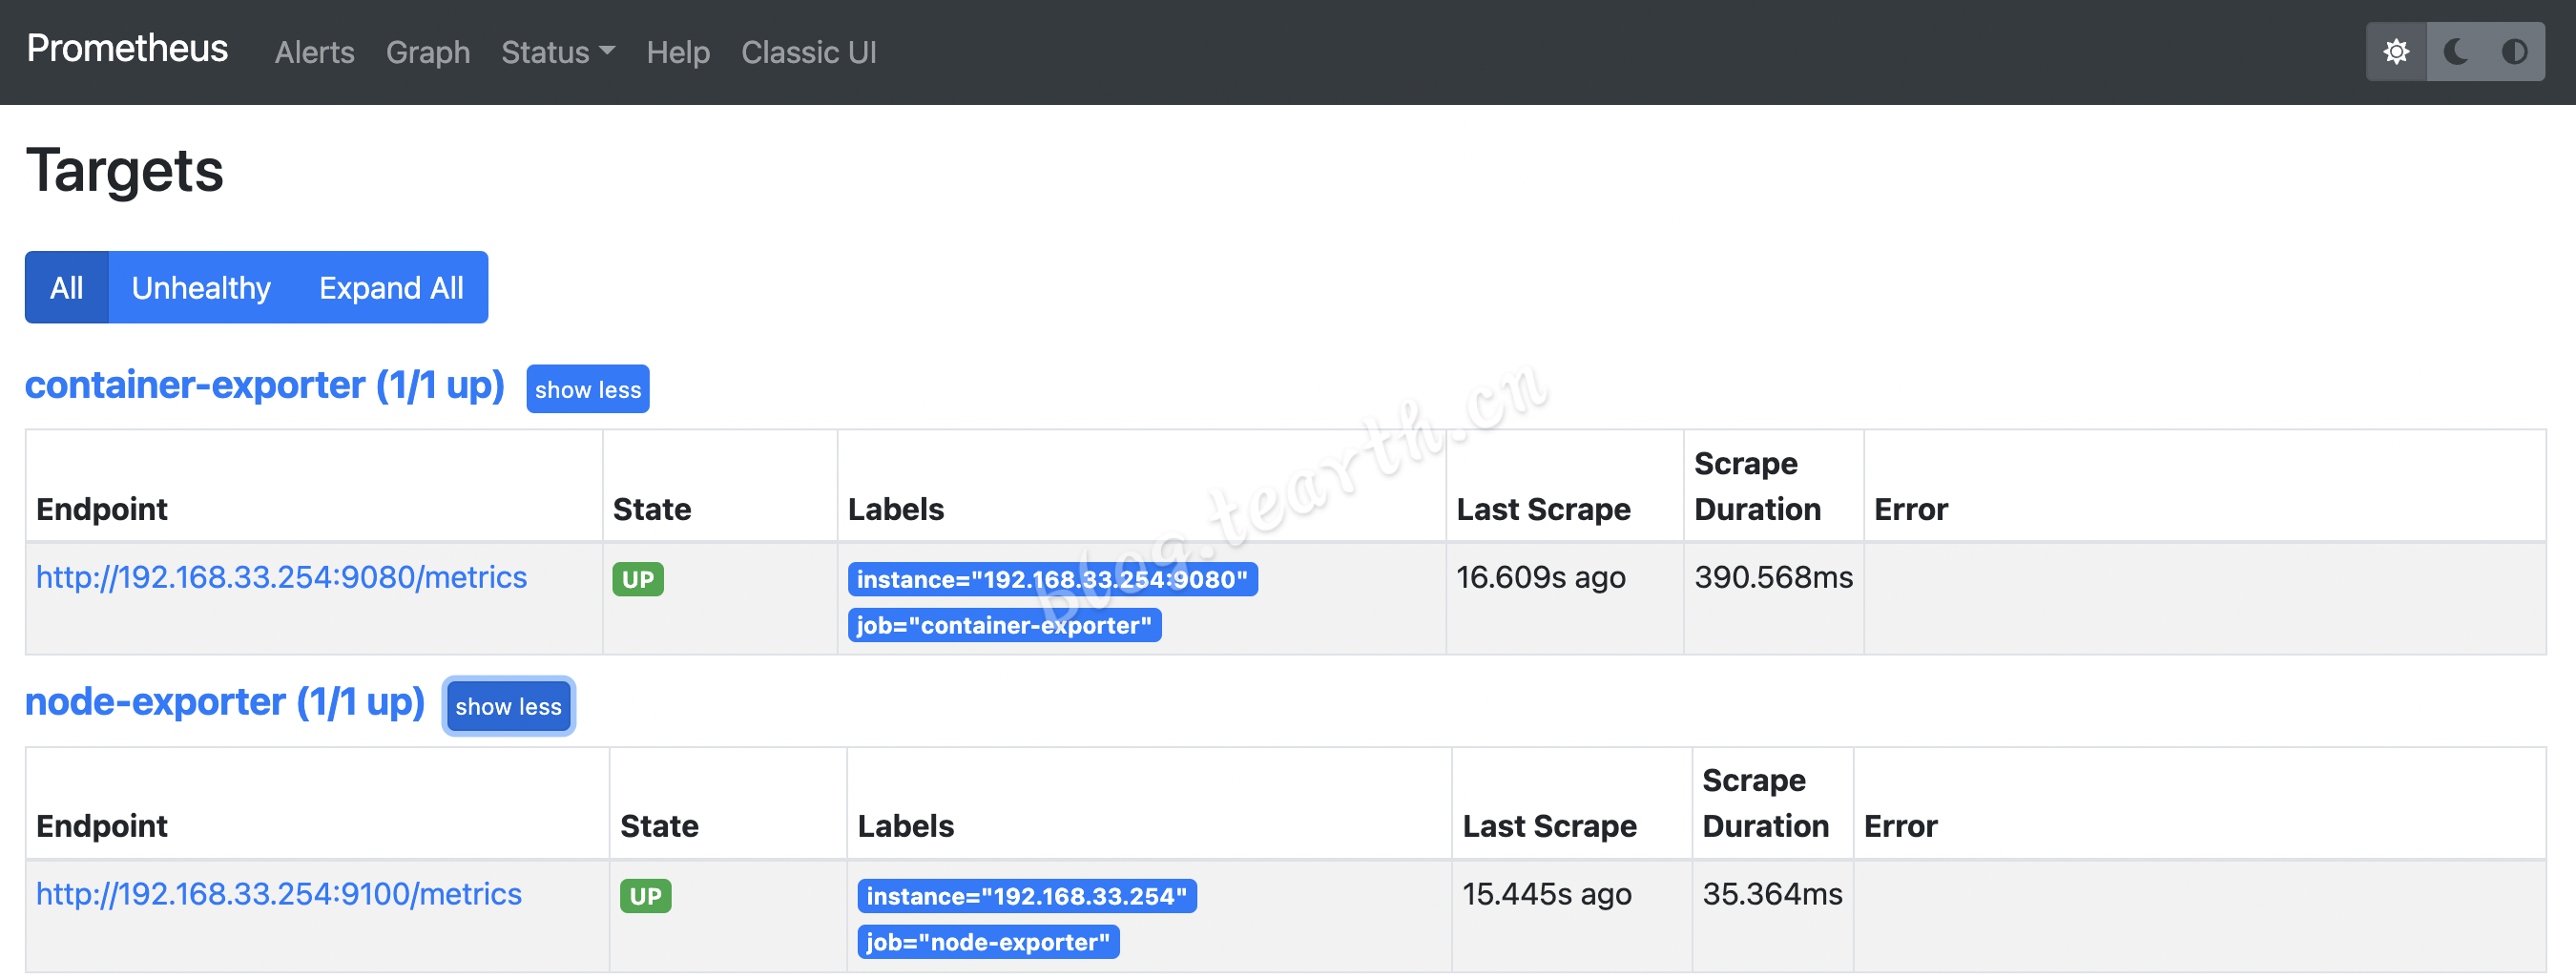
➜ ~ kubectl apply -f prometheus/prometheus-prometheus.yaml
prometheus.monitoring.coreos.com/k8s configured稍等片刻,浏览器打开prometheus Web,可以看到自定义的两个Target已经在线
自定义告警规则
在prometheus目录下创建一个新目录AdditionalAlertRules用来存放一些自定义告警规则配置文件。
➜ ~ mkdir -p prometheus/AdditionalAlertRules在目录AdditionalAlertRules中新建一个文件:additional-alert-rules-prometheusRule.yaml,示例如下:
apiVersion: monitoring.coreos.com/v1
kind: PrometheusRule
metadata:
  labels:
    app.kubernetes.io/component: additional-alert-rules
    app.kubernetes.io/name: additional-alert-rules
    app.kubernetes.io/part-of: kube-prometheus
    app.kubernetes.io/version: 2.3.0
    prometheus: k8s
    role: alert-rules
  name: additional-alert-rules
  namespace: monitoring
spec:
  groups:
    - name: additional-alert-rules
      rules:
        ## 以下内容自定义
        # example 1
        - alert: PrometheusTargetMissing
          expr: up == 0
          for: 0m
          labels:
            severity: critical
          annotations:
            summary: Prometheus target missing (instance {{ $labels.instance }})
            description: "A Prometheus target has disappeared. An exporter might be crashed.\n  VALUE = {{ $value }}\n  LABELS = {{ $labels }}"
        # example 2
        - alert: HostOutOfDiskSpace
          expr: (node_filesystem_avail_bytes * 100) / node_filesystem_size_bytes < 10 and ON (instance, device, mountpoint) node_filesystem_readonly == 0
          for: 2m
          labels:
            severity: warning
          annotations:
            summary: Host out of disk space (instance {{ $labels.instance }})
description: "Disk is almost full (< 10% left)\n VALUE = {{ $value }}\n LABELS = {{ $labels }}"使用kubectl apply创建相关资源
# 创建定义的PrometheusRule资源
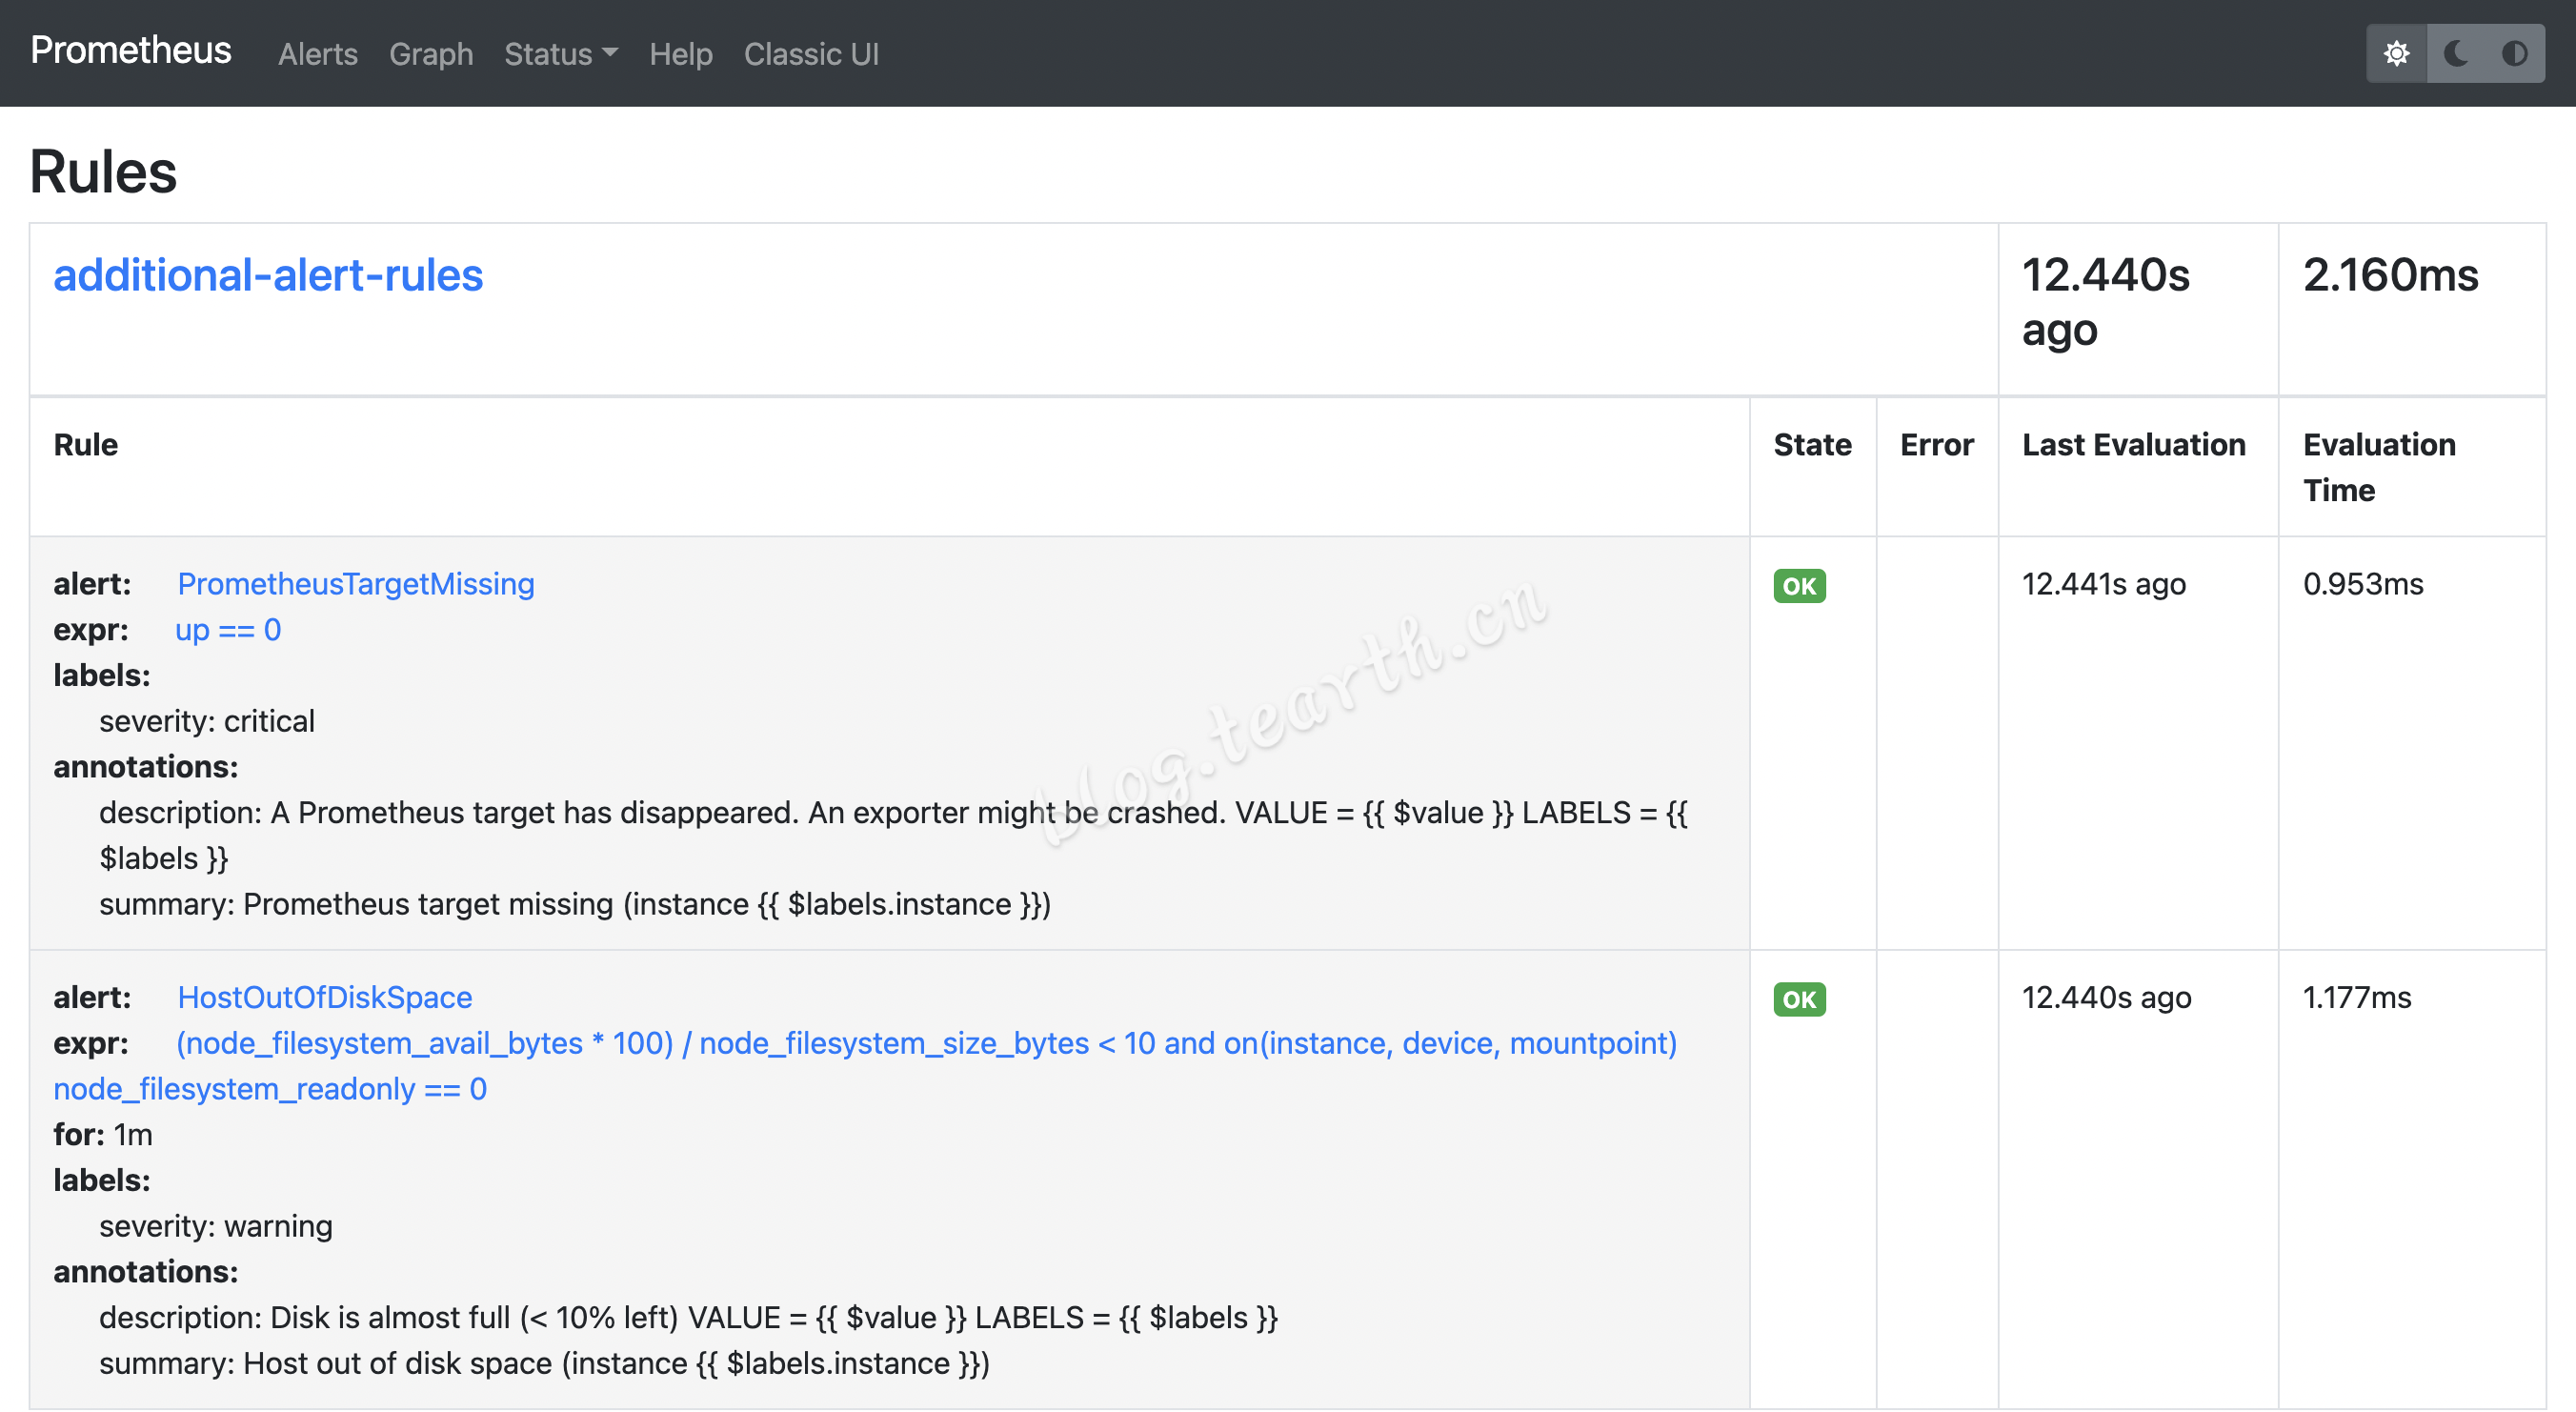
➜ ~ kubectl apply -f prometheus/AdditionalAlertRules
prometheusrule.monitoring.coreos.com/additional-alert-rules created浏览器打开prometheus Web,可以看到自定义的两条规则已经在线
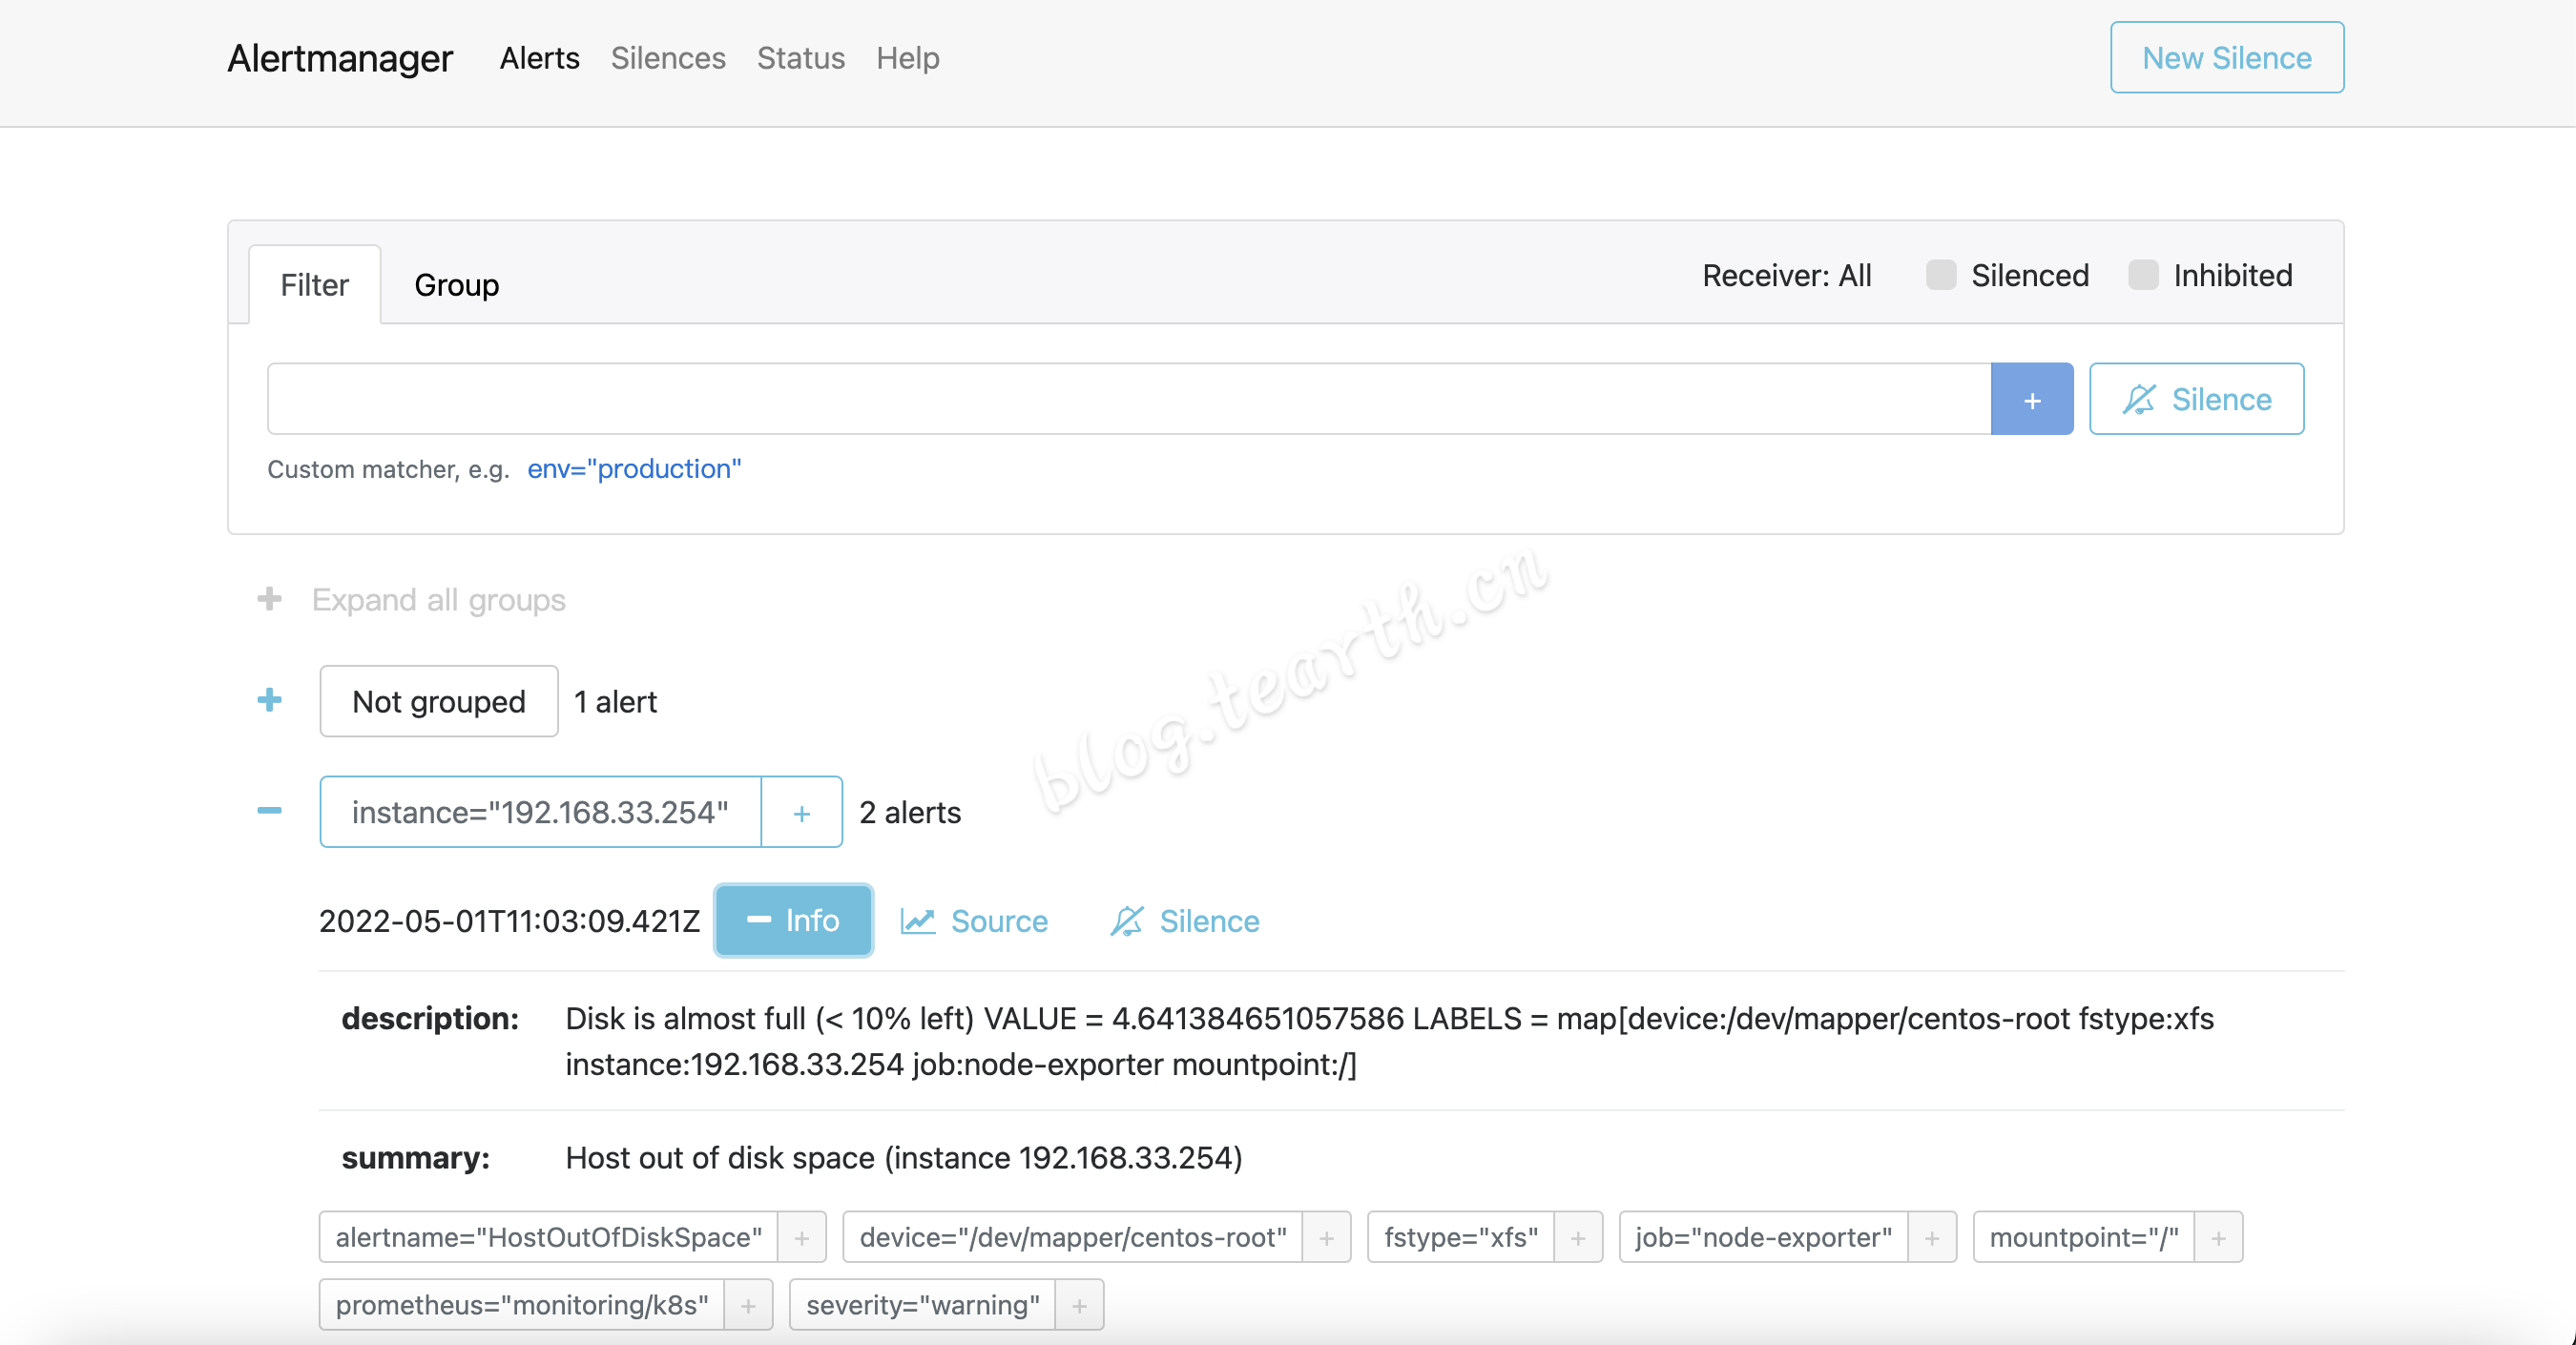
为了测试规则是否生效,在根目录创建一个大文件,等待片刻,就会在alertmanager Web看到有一条磁盘使用率的告警产生
自定义route和receivers
首先备份alertmanager目录下的alertmanager-secret.yaml
➜ ~ cp alertmanager/alertmanager-secret.yaml alertmanager/alertmanager-secret.yaml.backup然后修改alertmanager-secret.yaml,将自定义的route和receivers添加到该文件中,示例如下:
apiVersion: v1
kind: Secret
metadata:
  labels:
    app.kubernetes.io/component: alert-router
    app.kubernetes.io/instance: main
    app.kubernetes.io/name: alertmanager
    app.kubernetes.io/part-of: kube-prometheus
    app.kubernetes.io/version: 0.23.0
  name: alertmanager-main
  namespace: monitoring
stringData:
  alertmanager.yaml: |-
    # 以下内容自定义
    global:
      resolve_timeout: 1m
    route:
      group_by: ['instance']
      group_wait: 10s
      group_interval: 5m
      repeat_interval: 5m
      receiver: 'PrometheusAlert'
    receivers:
    - name: 'PrometheusAlert'
      webhook_configs:
      - url: http://192.168.33.3:8080/prometheusalert?type=fs&tpl=custom-prometheus-feishu&fsurl=https://open.feishu.cn/open-apis/bot/v2/hook/000000-0000-0000-0000-000000000000
type: Opaque使用kubectl apply更新相关资源
# 更新Secret资源
 ➜  ~ kubectl apply -f alertmanager/alertmanager-secret.yaml
secret/alertmanager-main configured
浏览器打开alertmanager Web,点击菜单Status,可以看到自定义的路由和告警接受方式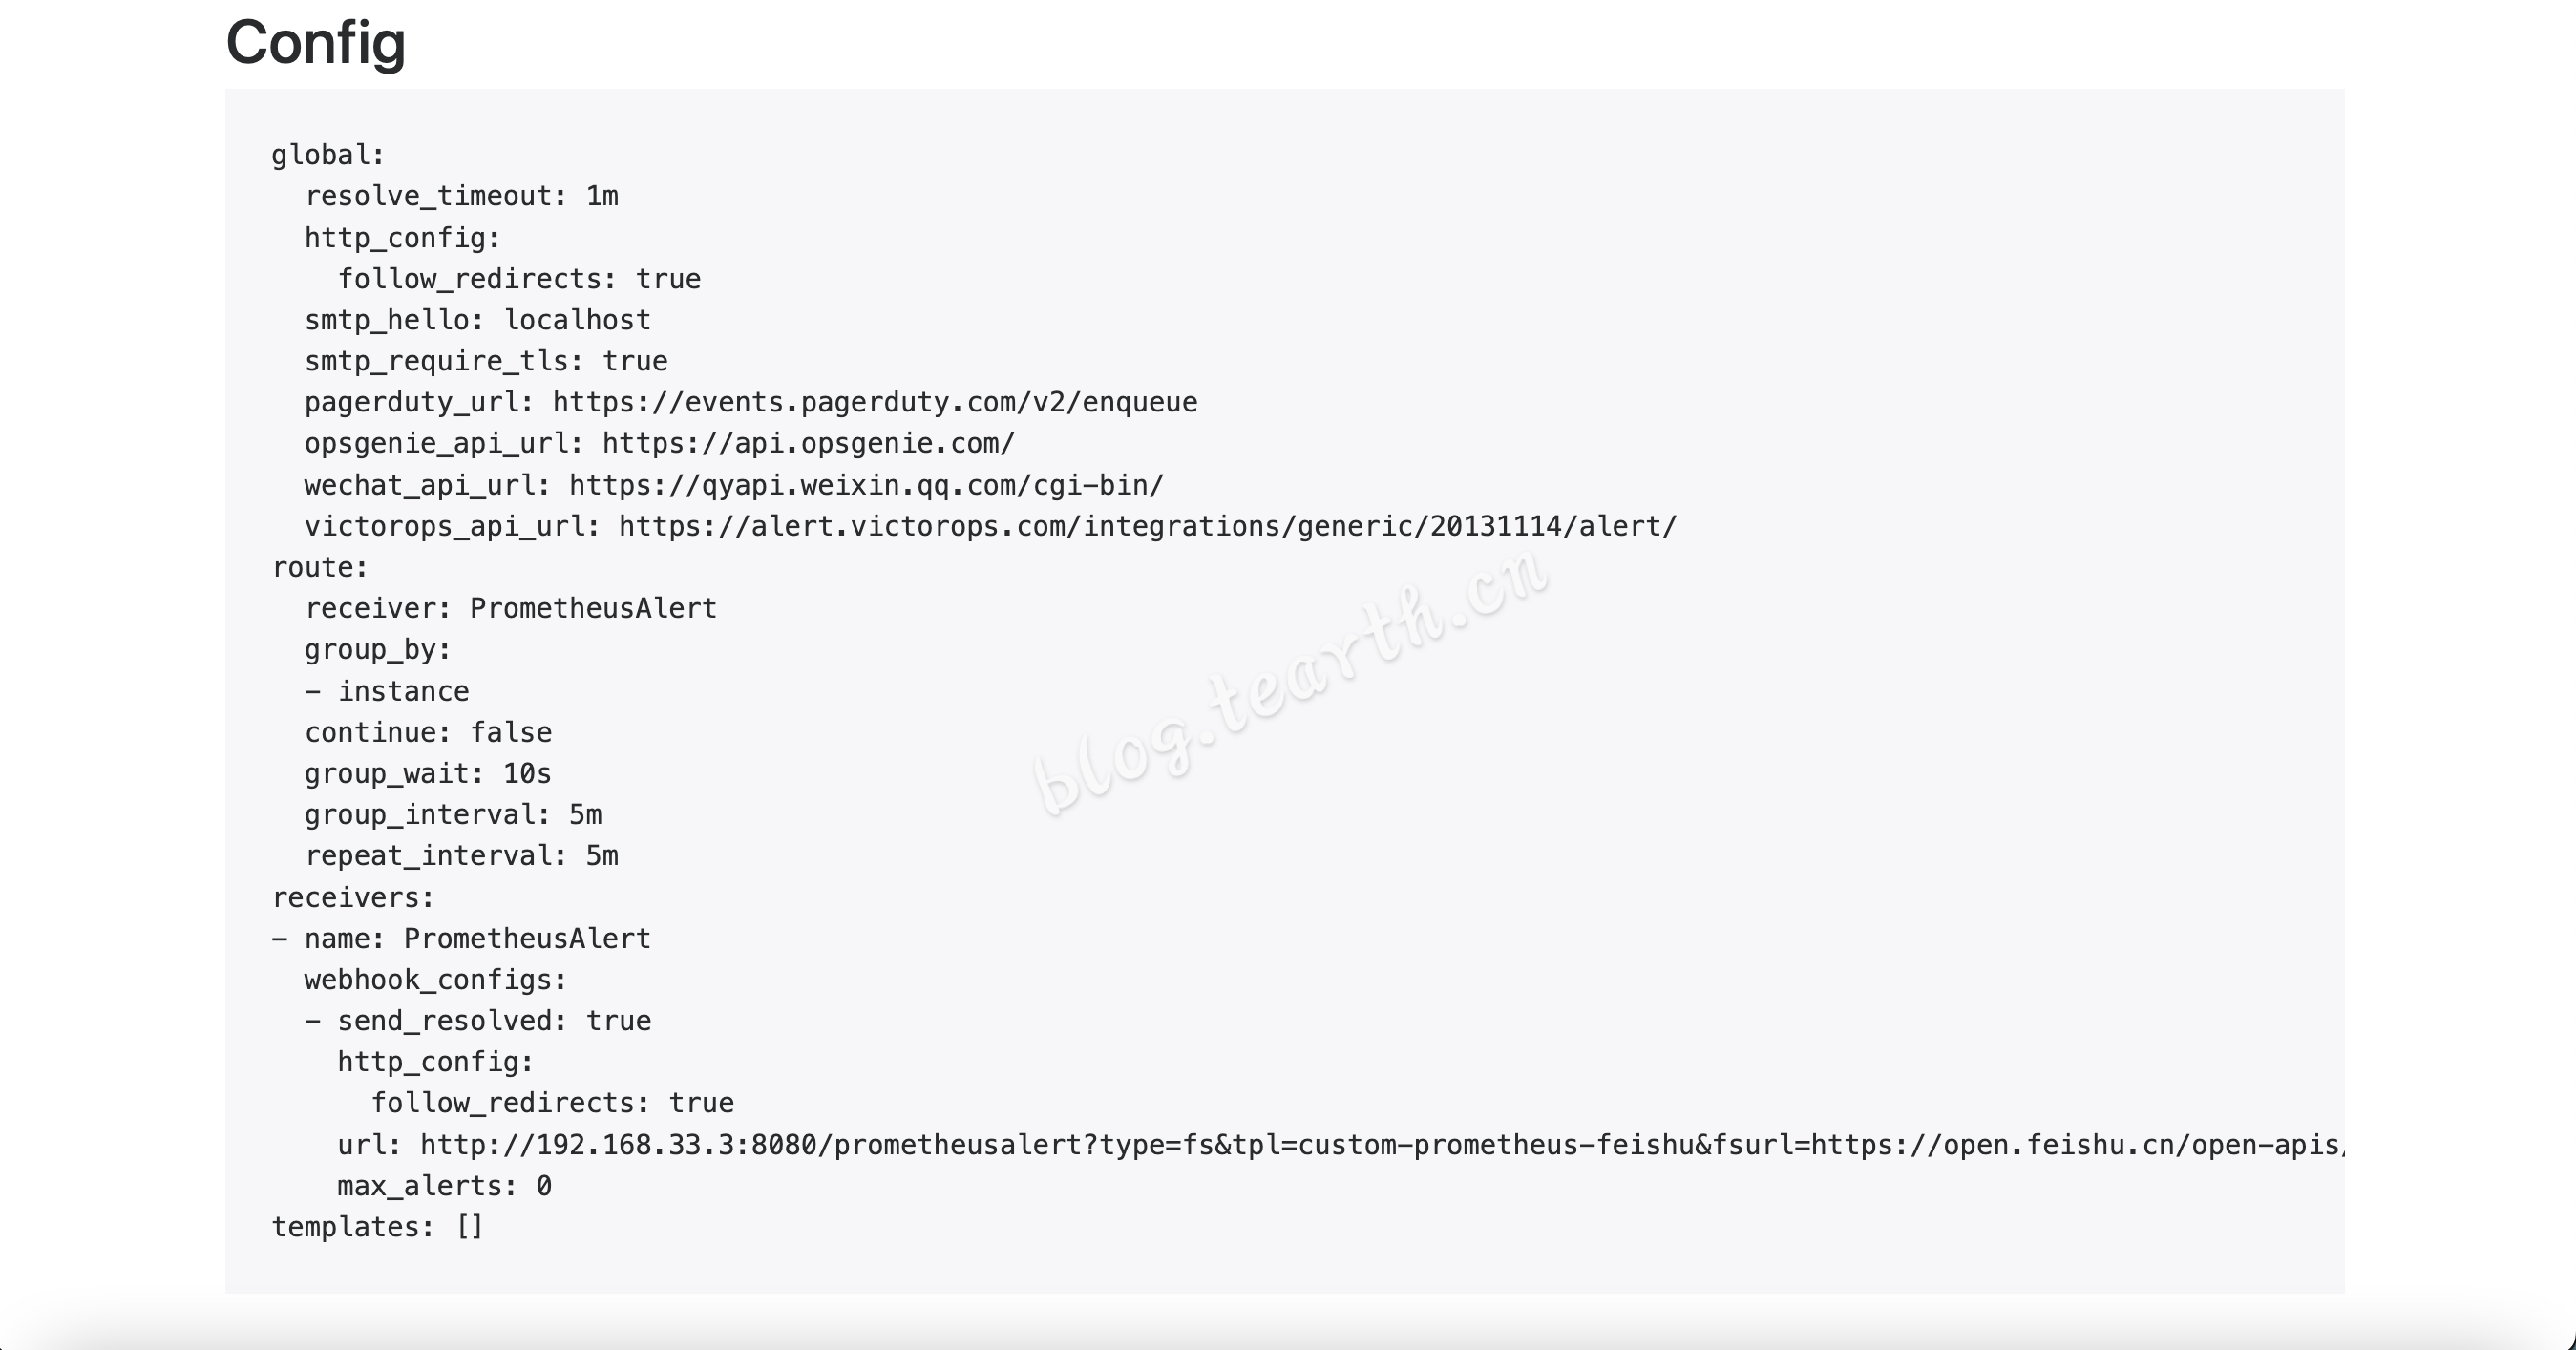
目录结构 (12 directories, 89 files)
.
├── alertmanager
│   ├── alertmanager-alertmanager.yaml
│   ├── alertmanager-podDisruptionBudget.yaml
│   ├── alertmanager-prometheusRule.yaml
│   ├── alertmanager-secret.yaml
│   ├── alertmanager-secret.yaml.backup # 备份文件
│   ├── alertmanager-serviceAccount.yaml
│   ├── alertmanager-serviceMonitor.yaml
│   └── alertmanager-service.yaml
├── blackboxExporter
│   ├── blackboxExporter-clusterRoleBinding.yaml
│   ├── blackboxExporter-clusterRole.yaml
│   ├── blackboxExporter-configuration.yaml
│   ├── blackboxExporter-deployment.yaml
│   ├── blackboxExporter-serviceAccount.yaml
│   ├── blackboxExporter-serviceMonitor.yaml
│   └── blackboxExporter-service.yaml
├── grafana
│   ├── grafana-config.yaml
│   ├── grafana-dashboardDatasources.yaml
│   ├── grafana-dashboardDefinitions.yaml
│   ├── grafana-dashboardSources.yaml
│   ├── grafana-deployment.yaml
│   ├── grafana-PersistentVolumeClaim.yaml # 创建Grafana PVC
│   ├── grafana-serviceAccount.yaml
│   ├── grafana-serviceMonitor.yaml
│   └── grafana-service.yaml
├── kubernetesControlPlane
│   ├── kubernetesControlPlane-prometheusRule.yaml
│   ├── kubernetesControlPlane-serviceMonitorApiserver.yaml
│   ├── kubernetesControlPlane-serviceMonitorCoreDNS.yaml
│   ├── kubernetesControlPlane-serviceMonitorKubeControllerManager.yaml
│   ├── kubernetesControlPlane-serviceMonitorKubelet.yaml
│   └── kubernetesControlPlane-serviceMonitorKubeScheduler.yaml
├── kubeStateMetrics
│   ├── kubeStateMetrics-clusterRoleBinding.yaml
│   ├── kubeStateMetrics-clusterRole.yaml
│   ├── kubeStateMetrics-deployment.yaml
│   ├── kubeStateMetrics-prometheusRule.yaml
│   ├── kubeStateMetrics-serviceAccount.yaml
│   ├── kubeStateMetrics-serviceMonitor.yaml
│   └── kubeStateMetrics-service.yaml
├── nodeExporter
│   ├── nodeExporter-clusterRoleBinding.yaml
│   ├── nodeExporter-clusterRole.yaml
│   ├── nodeExporter-daemonset.yaml
│   ├── nodeExporter-prometheusRule.yaml
│   ├── nodeExporter-serviceAccount.yaml
│   ├── nodeExporter-serviceMonitor.yaml
│   └── nodeExporter-service.yaml
├── prometheus
│   ├── AdditionalAlertRules # 自定义抓取目标配置
│   │   └── additional-alert-rules-prometheusRule.yaml
│   ├── AdditionalScrapeConfigs # 自定义告警规则
│   │   ├── additional-scrape-configs-ConfigMap.yaml
│   │   └── additional-scrape-configs-Secret.yaml
│   ├── kubePrometheus-prometheusRule.yaml
│   ├── prometheus-clusterRoleBinding.yaml
│   ├── prometheus-clusterRole.yaml
│   ├── prometheus-podDisruptionBudget.yaml
│   ├── prometheus-prometheusRule.yaml
│   ├── prometheus-prometheus.yaml
│   ├── prometheus-roleBindingConfig.yaml
│   ├── prometheus-roleBindingSpecificNamespaces.yaml
│   ├── prometheus-roleConfig.yaml
│   ├── prometheus-roleSpecificNamespaces.yaml
│   ├── prometheus-serviceAccount.yaml
│   ├── prometheus-serviceMonitor.yaml
│   └── prometheus-service.yaml
├── prometheusAdapter
│   ├── prometheusAdapter-apiService.yaml
│   ├── prometheusAdapter-clusterRoleAggregatedMetricsReader.yaml
│   ├── prometheusAdapter-clusterRoleBindingDelegator.yaml
│   ├── prometheusAdapter-clusterRoleBinding.yaml
│   ├── prometheusAdapter-clusterRoleServerResources.yaml
│   ├── prometheusAdapter-clusterRole.yaml
│   ├── prometheusAdapter-configMap.yaml
│   ├── prometheusAdapter-deployment.yaml
│   ├── prometheusAdapter-podDisruptionBudget.yaml
│   ├── prometheusAdapter-roleBindingAuthReader.yaml
│   ├── prometheusAdapter-serviceAccount.yaml
│   ├── prometheusAdapter-serviceMonitor.yaml
│   └── prometheusAdapter-service.yaml
├── prometheusOperator
│   ├── prometheusOperator-clusterRoleBinding.yaml
│   ├── prometheusOperator-clusterRole.yaml
│   ├── prometheusOperator-deployment.yaml
│   ├── prometheusOperator-prometheusRule.yaml
│   ├── prometheusOperator-serviceAccount.yaml
│   ├── prometheusOperator-serviceMonitor.yaml
│   └── prometheusOperator-service.yaml
└── setup
    ├── 0alertmanagerConfigCustomResourceDefinition.yaml
    ├── 0alertmanagerCustomResourceDefinition.yaml
    ├── 0podmonitorCustomResourceDefinition.yaml
    ├── 0probeCustomResourceDefinition.yaml
    ├── 0prometheusCustomResourceDefinition.yaml
    ├── 0prometheusruleCustomResourceDefinition.yaml
    ├── 0servicemonitorCustomResourceDefinition.yaml
    ├── 0thanosrulerCustomResourceDefinition.yaml
    └── namespace.yaml

12 directories, 89 files